What is regression?
In the dictionary, the word regression basically means ‘to go back’. In terms of statistics too, the meaning is not too different – it means ‘to go back to the past data to explain the process that generates the data’.
In statistics, a model is a mathematical equation that simplifies and generalises a particular scenario. Therefore, a regression model is a mathematical equation that generalises the past data (dependent and independent variables). When that mathematical equation is a linear one, you have a linear regression model.
What can we do with a regression model?
They say, history repeats itself. That assertion is also the main reason why we do a regression analysis. Since history repeats itself, we could be fairly certain when we say that the pattern in the data that was seen in the past will continue in the future. Regression can model the past data, therefore, that same model should be useful to predict the future as well.
The ability to use regression to model situations and then predict future outcomes make regression models extremely powerful tools in business. The power of regression models contribute to their massive popularity.
Let us understand this with an example. We look at a company’s balance sheets for the last ten years. Intuitively, we imagine that the Selling, General and Administrative Expenses (SG&A) in the balance sheet would be linked with the revenues of the company for a given year. Now, if the SG&A has indeed been related to the revenue in the past data, it is reasonable to believe that they would continue to be related in the future as well. Therefore, for a given (imaginary) revenue figure, it is going to be possible to predict the SG&A figure in the future.
Understanding the past data
The ability of a regression model to be able to accurately predict the future depends on how strong the relationship between the independent and the dependent variable has been in the past. The model can only be as good as the quality of the data that has gone in to it.
We can get an idea about the strength of the relationship between the dependent and independent data by computing the coefficient of linear correlation between them. If the coefficient of linear correlation shows a strong relationship (closer to 1, irrespective of the sign), then we can go on to build a regression model. Of course, this assumes that there is a logical cause-and-effect relationship between the two variables.
Identifying the linear regression model
Remember, the regression model is nothing but the linear equation that describes the data. The easiest way to get the equation on Microsoft Excel is by having it displayed on the scatter plot itself.
Take a look at the data in the table below:
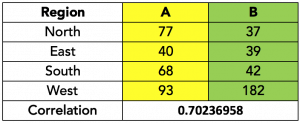
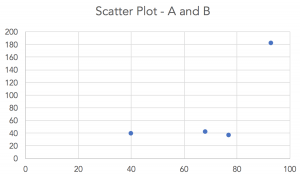
Since the correlation is reasonably strong, let us create a scatter plot:
Now, we right-click one of the data points and select “Add Trendline” from the options that appear:
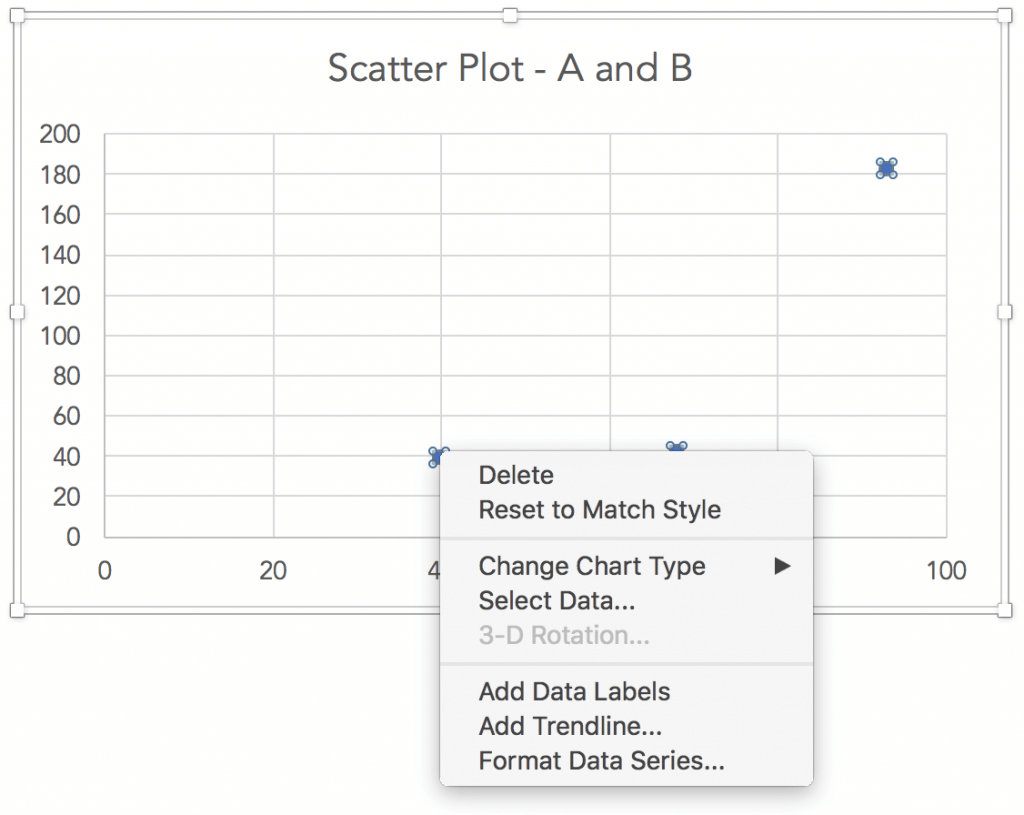
When we select “Add Trendline”, various trend line options appear. The default trendline is linear. Further down on the same box, there is a checkbox that says “Display equation on chart”. Checking that box would show the equation of the linear trendline on the chart:
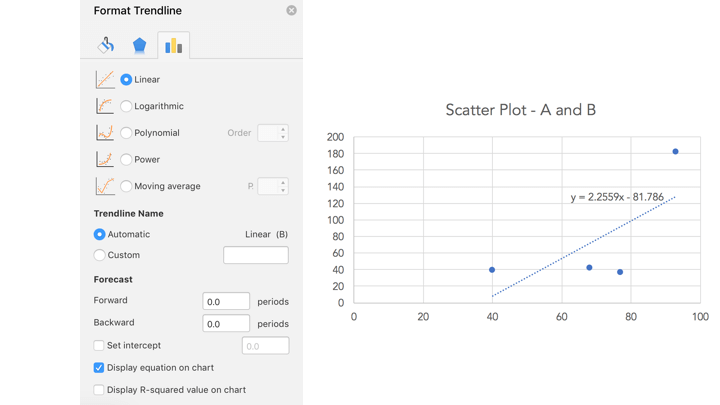
The linear regression model is nothing but the linear equation displayed on the chart – y = 2.2559x – 81.786. The existing data generation process can be approximated by this mathematical equation.
Coefficient of Determination
If you look at the Format Trendline options above, below the “Display equation on chart” checkbox, there is a checkbox for “Display R-squared value on chart”. Checking that will result in the R2 value being displayed on the chart along with the equation. Now, what is R2?
You would recall that the coefficient of correlation is denoted by R. Therefore, R2 is nothing but the square of the coefficient of correlation. This value is called the coefficient of determination, or as Excel calls it, R-squared. As the coefficient of correlation ranges between -1 to 0 and then to 1, coefficient of determination ranges between 0 and 1, with the negative values getting squared into positive values.
The coefficient of determination indicates the overall fit of the regression model. The higher the coefficient of determination (closer to 1), the better the fit of the regression model.
In Excel, there is no direct function to compute the coefficient of determination without the chart. You must first compute the coefficient of correlation, and then square it. Both can be done in the same cell, by typing: =(CORREL(array1,array2)^2) where the ^2 achieves the squaring.
