Quartiles are a frequently used method to split the data and understand the spread.
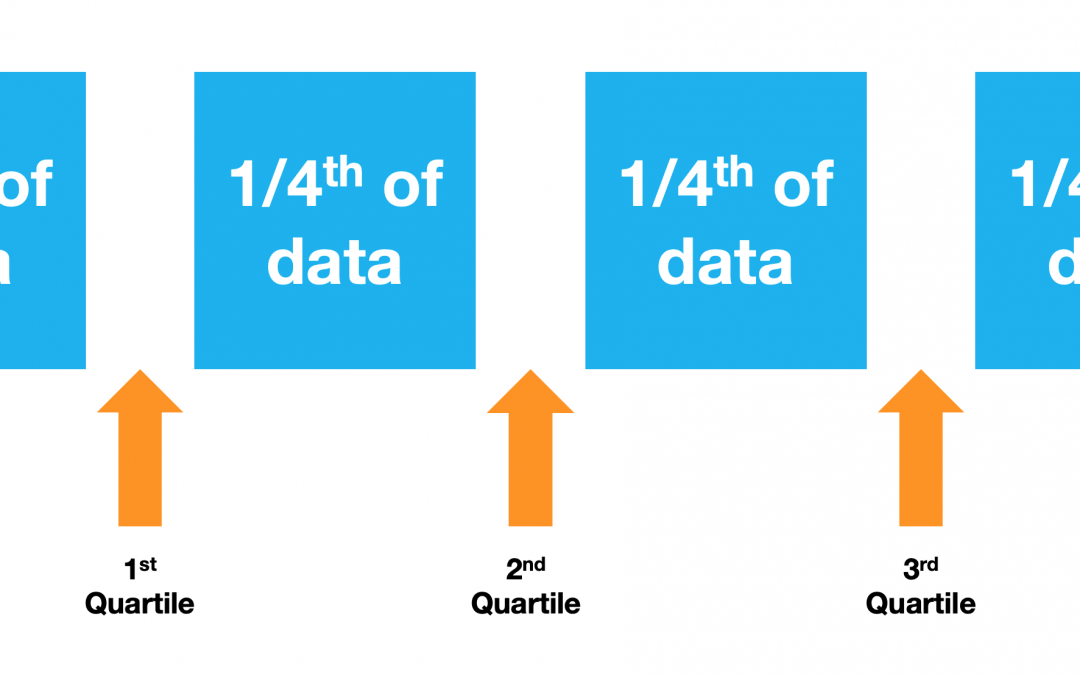
In general, data can be divided in various groupings such that an equal number of points are in each group. Such groups are formed by cutting at specific points called quantiles. If the quantiles divide the data into 100 groups, then they’re called percentiles. If the quantiles divide the data into ten groups, they’re called deciles. In case of quartiles, as the name implies, the data is divided into four groups.
Clearly then, quartiles and percentiles are related. How? Each quartile separates 25%, or one quarter, of the complete dataset.
Till about a decade ago, calculating quartiles in Microsoft Excel was a relatively uncomplicated affair. You’d type =QUARTILE and provide the data range and the quartile number as the arguments, and the desired quartile value would come up. Easy peasy!
However, since then, Microsoft introduced a new change in the the quartile formula that has resulted in some bit of confusion. Instead of just one formula, there are now two quartile formulas: =QUARTILE.EXC and =QUARTILE.INC, meaning quartile exclusive and quartile inclusive, respectively.
Let us understand them in a bit more detail.
I already mentioned that quartiles are related to percentiles. In fact, quartiles are, in a way, based on percentiles. Think about percentiles for a moment – if I say 10 percentile, would 10 be included or would just greater than 10 only be included?
As you may imagine, there is no consensus among statisticians. Some say that percentiles should be calculated as ‘greater than or equal to’ while others say they should be ‘greater than’.
Why should a software take sides and become the target of hate of one of the groups? So, Microsoft Excel chose to provide both options.
Quartile inclusive calculation is of the ‘greater than or equal to’ form. The ‘equal to’ part indicates the inclusiveness of the extreme value of the quartile.
In the case of quartile exclusive, the calculation is of the ‘greater than’ form, and therefore, the lower bound is excluded.
Let us delve in a little further. Consider the 2nd quartile before the others. The 2nd quartile represents 50 percentile. Therefore, the 2nd quartile cuts the dataset into two equal halves. What does that mean, in other words? Simply put, that means, the 2nd quartile is the median of the dataset.
Now that the dataset is cut into two parts, each part would have its own median. The median of the lower half is the 1st quartile, while the median of the upper half is the 3rd quartile.
How does this explain the inclusive and exclusive, though?
To understand those, let us consider a dataset with five data points, or five values.

Evidently, the third value is the median value. Now, in the case of quartile exclusive, the median is not considered in either half of the data. Also, for each half, the extreme values are excluded. As a result, the quartile exclusive cannot compute the Quartile Zero because the minimum value is excluded. Simliarly, it cannot compute 4th quartile either because the maximum value is also excluded.
Go on, try =QUARTILE.EXC(…data range,0) or =QUARTILE.EXC(…data range,4). You’ll see a #NUM! error.
So what’s different in case of quartile inclusive?

Here the median value is considered in both halves. The lower half runs from minimum value to the median, and the upper half runs from the median all the way to the highest value. The medians of the two halves, once again, form the 1st quartile and 3rd quartile repectively.
Quartile inclusive can compute the Quartile Zero as well as 4th Quartile, returning the minimum and maximum values respectively.
2nd quartile return an identical value irespective of inclusive or exclusive, always returning the median. However, the 1st and the 3rd quartiles usually return different values. Consequently, the inter-quartile ranges (IQR) calculated by the two methods would be different.
Let’s understand with some numbers.


Looking at the diagrams above, it might be easy to see that the exclusive method would return a lower 1st quartile and a higher 3rd quartile, leading to a wider IQR than the inclusive method.
Finally, the all important question – which one should you use? In pretty much all the cases, I’d suggest the use of quartiles inclusive. Just in case you were wondering, the old =QUARTILE(…) formula in Microsoft Excel actually used the =QUARTILE.INC(…) calculation as well.
