Calculating Range in Excel
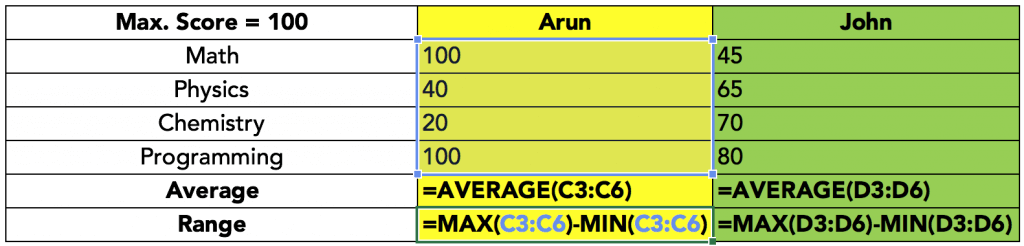
Excel does not offer a function to compute range. However, we can easily compute it by subtracting the minimum value from the maximum value. The formula would be =MAX()-MIN() where the dataset would be the referenced in both the parentheses. The =MAX() and =MIN() functions would find the maximum and the minimum points in the data. The difference between the two is the range. The higher the value of the range, the greater is the spread of the data.
Variance
The calculation of variance differs slightly depending on whether the data set describes a sample or the entire population. We have already seen that variance is nothing but the average of the squared deviations. When we are computing the variance for a population, we divide the sum of squared deviations by n. However, when we compute the variance for a sample, we divide the sum of squared deviations by (n-1).
This change is taken care of by Excel with two different functions: =VAR.P() for population variance, and =VAR.S() for sample variance.
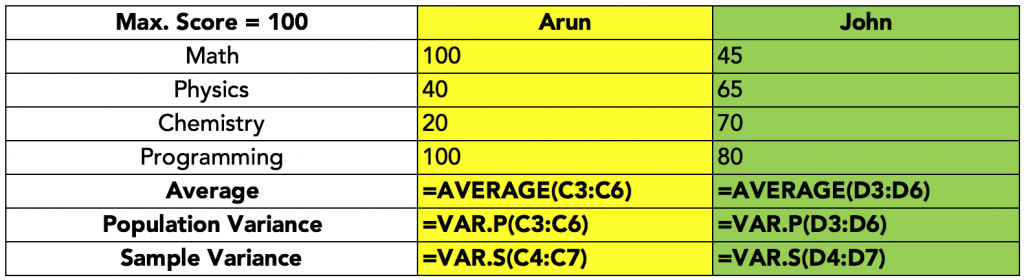
If we treat our data set as the population, then the variance for Arun is 1275, and the variance for John is 162.5. If we treat our data as a sample, the variance for Arun is 1189.58, and the variance for John is 50.
Older versions of Excel used =VARP() and =VARS() to calculate population variance, and sample variance, respectively.
Microsoft Excel also supports two other functions that calculate variance, =VARA() for sample variance, and =VARPA() for population variance. These differ from the other variance functions in how they treat certain text strings within the data.
=VARA() and =VARPA() can handle the following text strings that =VAR.S() and =VAR.P() ignore:
- Logical values such as TRUE and FALSE are counted, and treated as 1, and 0, respectively.
- Any text value is counted, and is treated as 0.
Standard Deviation
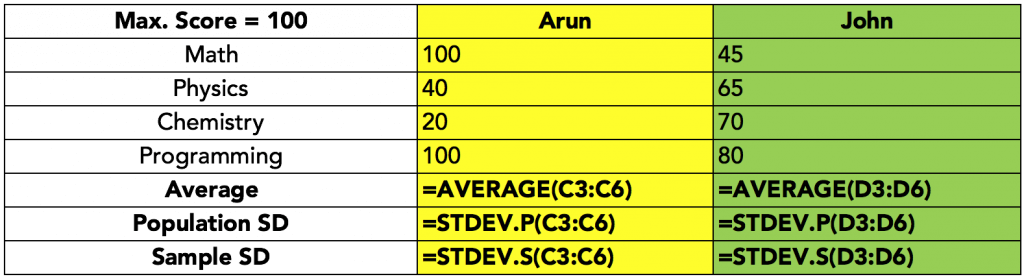
We already know that the standard deviation is nothing but the square root of variance. Naturally, if the variance computation is different for a sample and for a population, the standard deviation would be different as well. Similar to variance, Excel offers two functions, =STDEV.S() for sample standard deviation, and =STDEV.P() for population standard deviation.
Older versions of Excel support =STDEV() for sample standard deviation, and =STDEVP() for population standard deviation.
Standard deviation can also be computed on logical strings, and text, just like variance. The function for sample variance is =STDEVA() and the function for population variance is =STDEVPA(), if the text values are to be counted. The treatment of the text values remain the same as with =VARA() and =VARPA() functions.
Average Absolute Deviation
To avoid the problems associated with squaring the quantities with dimensions, we may want to check dispersion using the average of absolute values of the deviations. Excel includes a function for it as well. It can be computed with =AVEDEV().
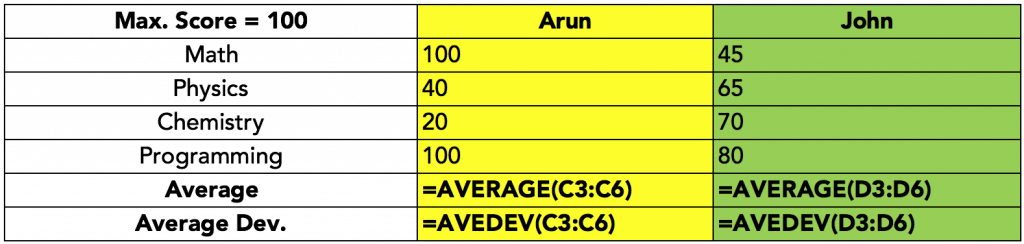
=AVEDEV() would ignore any text values, or logical values. However, cells with 0 are counted, and treated as numbers.
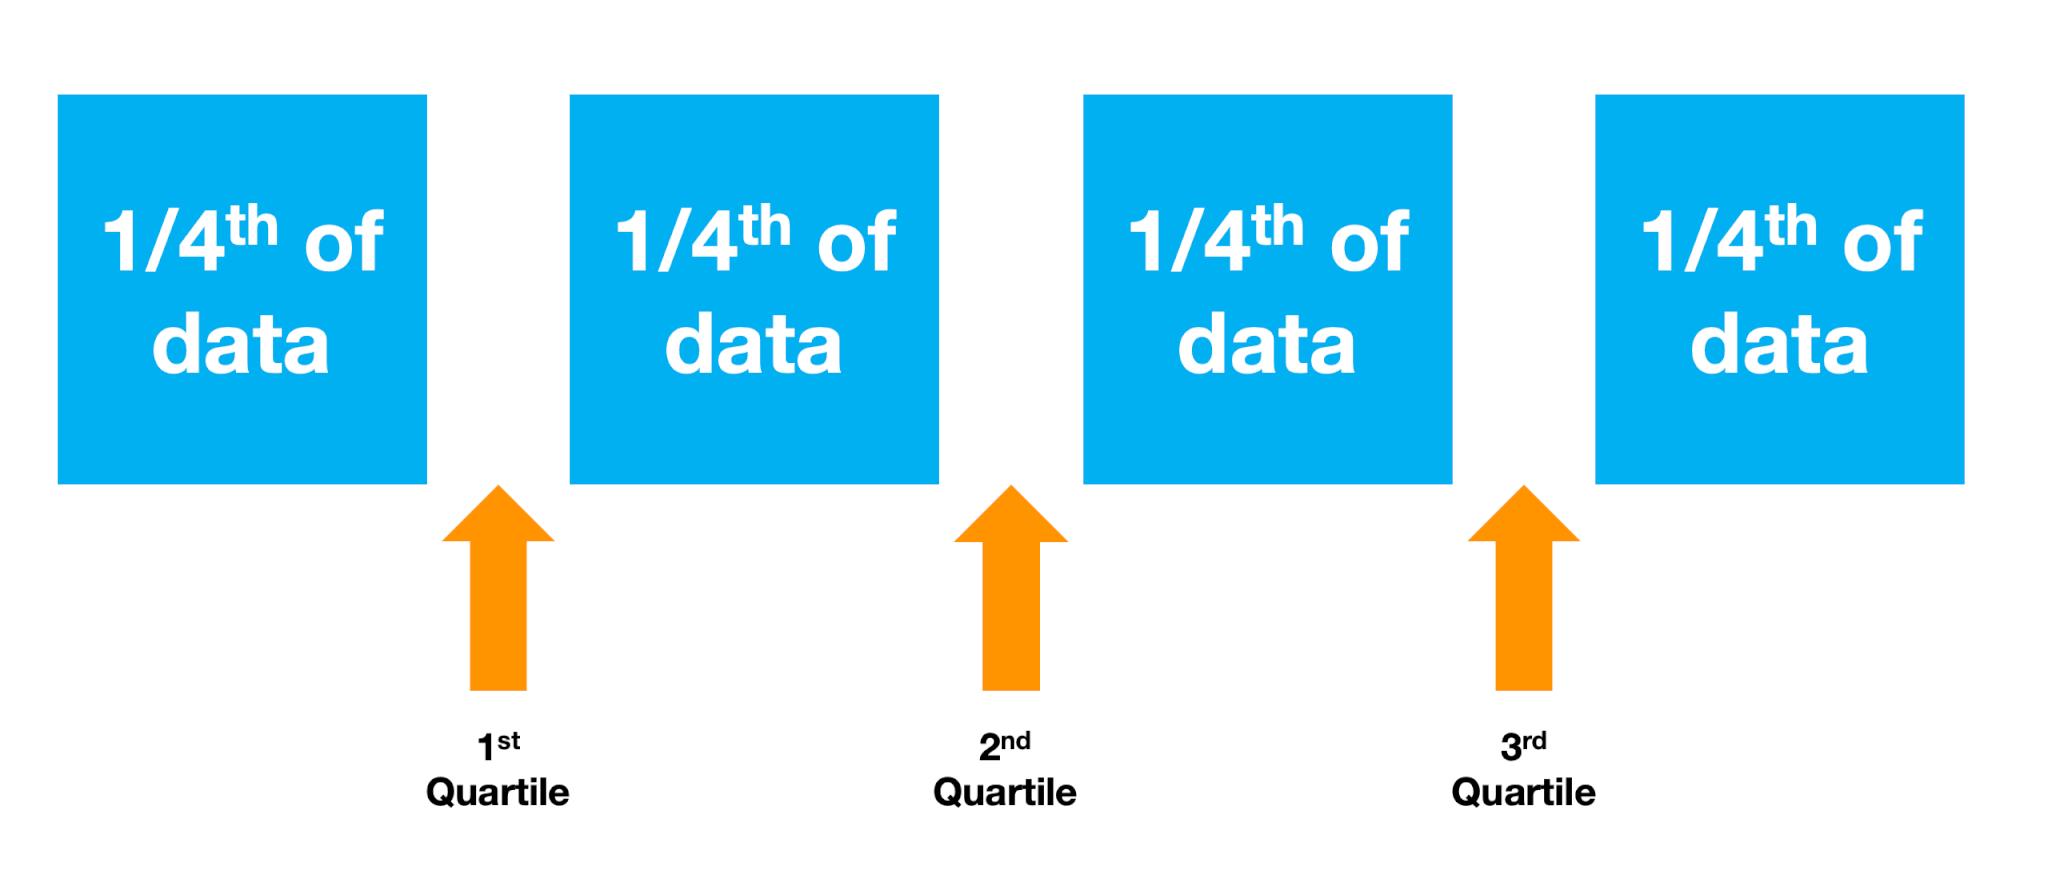
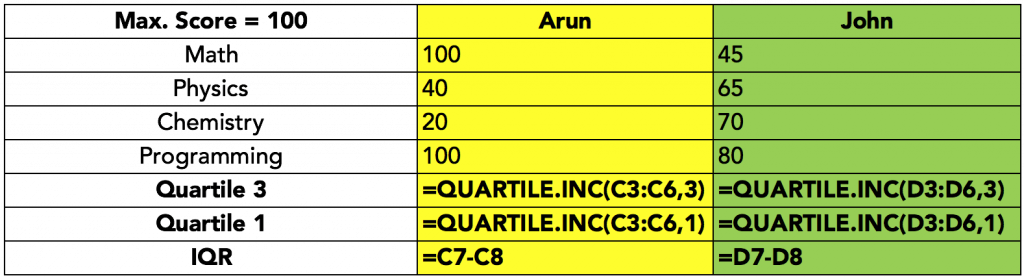
Inter-Quartile Range (IQR)
Microsoft Excel has two functions to compute quartiles. The inter-quartile range has to be calculated as the difference between the quartile 3 and quartile 1 values. You can read more about exclusive and inclusive quartiles here.
Quartiles can be calculated using =QUARTILE.INC() or =QUARTILE.EXC(). Both functions calculate the quartiles by calculating the percentiles on the data. However, the =QUARTILE.EXC calculates exclusive quartiles, and cannot calculate quartile 0 or quartile 4 (the extreme values are excluded). The inclusive function =QUARTILE.INC() can be used to calculate quartiles including quartile 0 and quartile 4.
Both functions have the following syntax: =QUARTILE.INC(range, quartile_number) where the quartile_number can be between 0 and 4. Any quartile number outside these values would return an error.
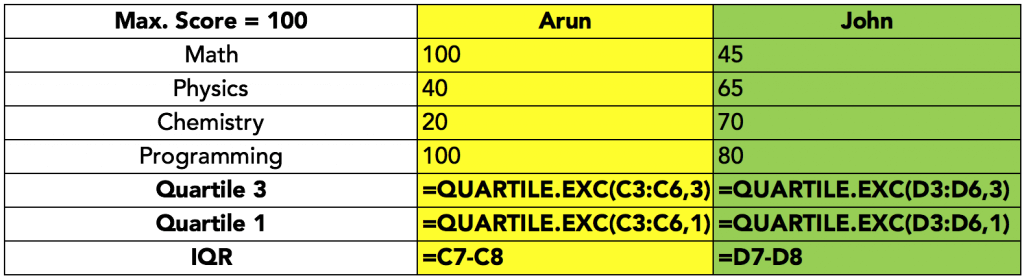
In both the above examples, Excel would calculate the quartile values by extrapolation because there are not enough data points. The quartile boundaries would lie between two values in our data set.
Older versions of Excel had a single function for quartile, =QUARTILE() and that was identical to the =QUARTILE.INC() function in the current versions. There was no equivalent of =QUARTILE.EXC() function in the earlier versions.