We have talked about regression models in the context of linear regression models in the previous post. A nonlinear regression model is one that describes a nonlinear relationship between the dependent and the independent variables.
Naturally, the equation of the model is a nonlinear equation. How are nonlinear equations different from linear equations? The simple answer is that in a linear equation, the change in the dependent variable is always proportional to the change in the independent variable; however, in a nonlinear equation, the dependent variable changes disproportionately with a change in the independent variable.
Degree of an equation
Nonlinear equations have a degree either less than 1, or greater than 1 (but never a degree equal to 1). Linear equations have a degree equal to 1.
A linear equation is of the form, y = ax + b. The variable x in this equation is raised to the power of 1. This is what we refer to when we say that the degree (also called the order) of the equation is 1.
A nonlinear equation would have a degree not equal to 1. For example, the equation y = ax2 + bx + c has one term with x raised to the power 2, and therefore, the degree (or order) of the equation is 2. Since this not an equation of order 1, it is a nonlinear equation.
Another nonlinear equation could be of the form y = ax4 + bx3 + cx2 + dx + e. The highest power that x is raised to in this equation is 4, and therefore this is a degree (or order) 4 equation.
Did you notice that the power to which x is raised to, always reduces by 1 for each consecutive x term?
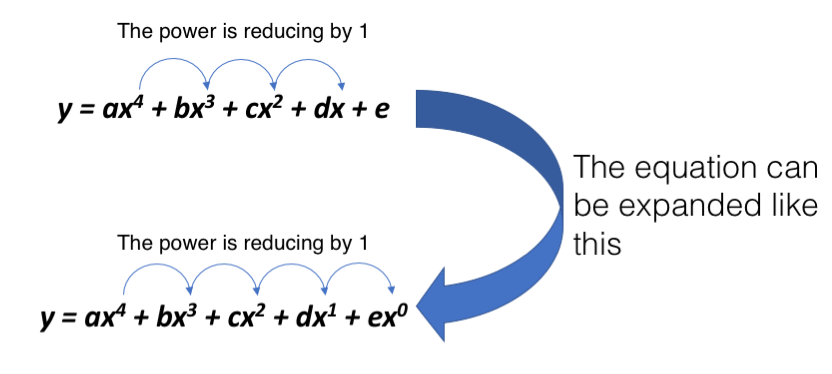
It is important to note here that the coefficients of some x terms may be zero. In such cases, that term is simply omitted while writing the equation. For example, y = ax4 + cx2 + dx + e simply means, that the coefficient of x3 is zero, and the term is, therefore, omitted.
Identifying the nonlinear regression model
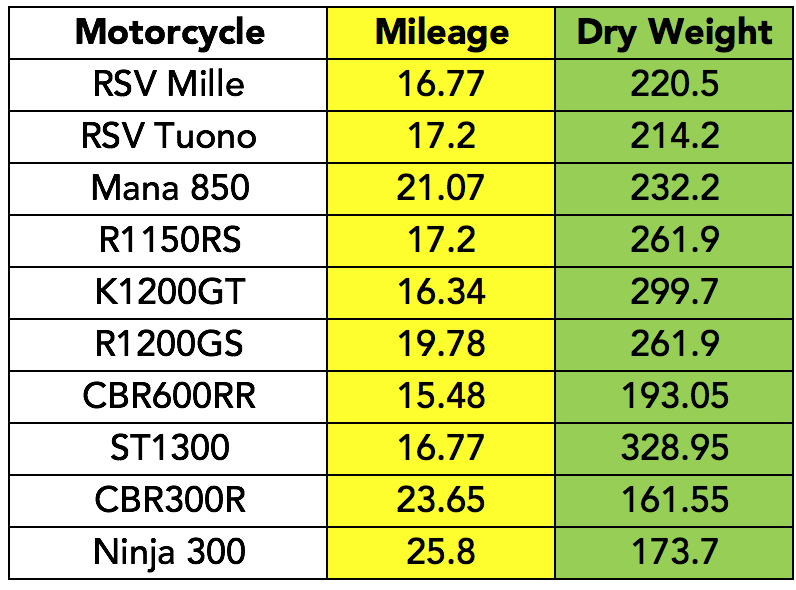
Similar to how we built a linear regression model on Excel using a scatter plot, we will build a nonlinear regression model. Take a look at the following data that lists out some motorbike models, their mileage (in kilometres per litre), and their dry weight (in kilograms):
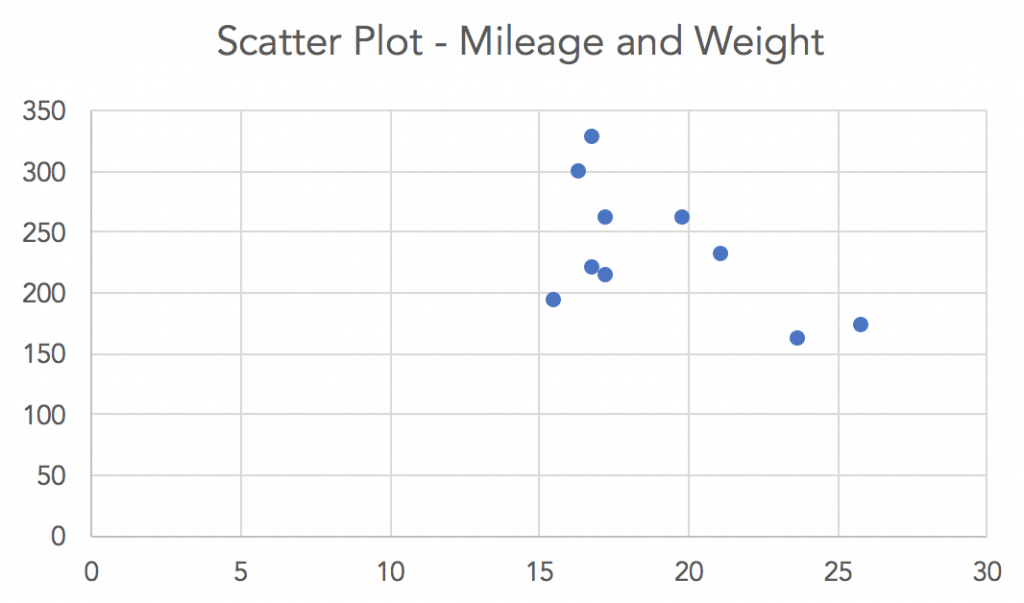
Let us create a scatter plot:
Next, we will add a trendline on the above data. The default trendline is linear, however, the trendline dialog box has the option to add other trendiness. We will select “Polynomial” (poly = many, nominal = names; refers to different x terms) trendline to get the nonlinear equation that we are looking for. As soon as we select “Polynomial”, the “Order” field next to it is enabled and we can set the order of the desired equation.
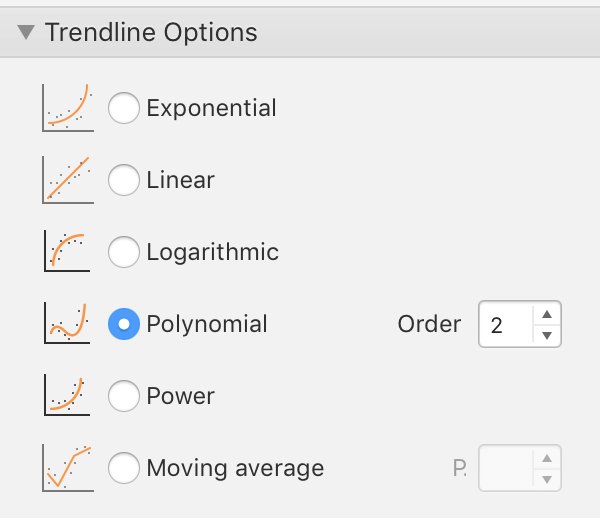 Excel allows us to choose an equation of order 2 to order 6. As we change the order of the equation we can see the trend line change. Let us look at an order 3 equation for our data.
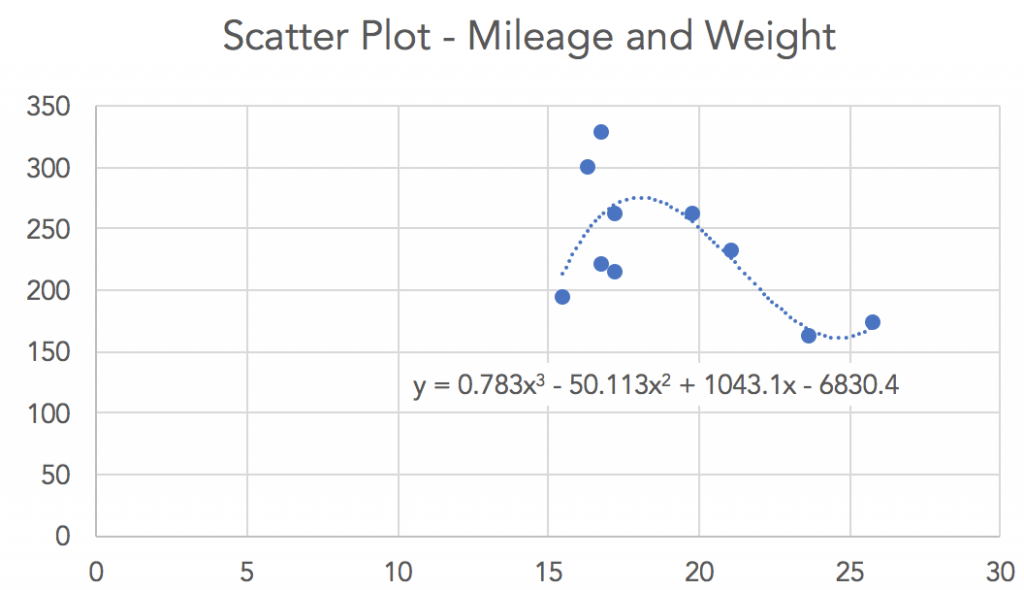
We now have our order 3 nonlinear regression model for the data, y = 0.783x3 – 50.113x2 + 1043.1x – 6830.4.
Two questions might immediately arise at this point:
- When to use nonlinear models?
- What is a suitable order to use for a nonlinear model?
When to use nonlinear models?
We could have created a linear model for the above data. That linear model would have been a valid model as well. Therefore, it is important to understand that there are no rules regarding linear and nonlinear models. In general, it is better to always start with a linear model and then checking the fit of the model. After that, you may want to build a nonlinear model on the same data and check the fit to see if it improves. If a nonlinear model significantly improves the fit over a linear model, it would good to use the nonlinear model.
The choice between linear and nonlinear models for a given dataset is a tradeoff between the fit of the model (which impacts the accuracy of the forecast made from the model), and the complexity of the model building and calculation.
What order of equation to choose?
When we select a “Polynomial” trendline, Excel starts with an equation of order 2. As we increase the order (to a maximum of 6), we can see how the curve changes. In most cases, higher order equations seem to fit all points of the past data better than a lower order equation. Therefore, it may be tempting to always choose an equation of the higher order.
However, some data points in the past data may be atypical values, or outliers, and must be treated as “noise” in the data. A higher order equation would model the noise treating it as data, rather than leaving the noisy data out of the model. As a rule, it is better to avoid equations of higher orders unless there are compelling reasons for using them.
Coefficient of Determination
Excel would offer a value of the coefficient of determination on the chart even in case of a nonlinear scatter, just like it would for a linear regression model. However, for a nonlinearly travelling pair of data, the coefficient of correlation is an incorrect value (cannot be correctly determined), and therefore, the coefficient of determination too cannot be correctly determined.
