
Spearman’s Coefficient of Rank Correlation (denoted by rho) is named after the British psychologist, Charles Edward Spearman. Rank correlation is a non-parametric variant of Karl Pearson’s Coefficient of Correlation. This means, while Pearson’s r requires an assumption of normality, Spearman’s rho does not require any such assumption. It achieves this by measuring the correlation between ranks of variables instead of the variables themselves. Since rho considers ranks, it can be used for ordinal, discrete, or continuous data.
In a previous post, we computed the Pearson’s Coefficient of Correlation between rice production, rainfall, and area under irrigation. Let us now revisit the same data, and compute the Spearman’s Coefficient of Rank Correlation.
Now, we already know that the Spearman’s Coefficient of Rank Correlation is calculated on ranks of variables. In Excel, there is no direct function to calculate Spearman’s rho. However, Excel allows us to calculate ranks, and then we can compute the correlation on the ranks to get rho.
We compute the average ranks in Excel using the =RANK.AVG(number, ref, [order]) function. In the arguments, the ‘number’ is the value to be ranked, the ‘ref’ is the set of all values within which the ranks are to be determined, and the ‘order’ specifies if the ranking is descending or ascending in order. Leaving order blank, or specifying 0 would result in descending rank where the highest value gets the smallest rank (such as, in the case of marks). Specifying 1 (or any other value) in order results in ascending rank ordering.
There is another =RANK(number, ref, [order]) function as well. The differences in the results of the two functions is basically about how they handle tied ranks. If two values are identical, =RANK() gives them the same rank, say 3, and the rank 4 is skipped. However, =RANK.AVG() takes an average of the two ranks (in this case, average of 3, and 4) and gives both values a rank of 3.5 each.
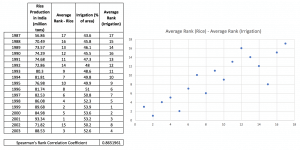
The table below shows the rice production and the rainfall data with average ranks calculated. The ranks are also plotted on a scatter. Once the ranks are available, computing the Spearman’s rho is simply a matter of using =CORREL(array1, array2) where the two arrays are those of the ranks.

Expectedly, the Spearman’s rho between rice production and rainfall is a low value, indicating that rice production is not too inextricably linked with the vagaries of rainfall.
Let us see the Spearman’s rho between rice production and area under irrigation.
Again, the conclusions are in line with what we saw using the Pearson’s Coefficient of Correlation.
This brings us to an important question – how do we decide when to use Pearson’s Coefficient of Correlation or Spearman’s Coefficient of Rank Correlation? The answer lies in the nature of data. If the data available is normally distributed about the mean, Pearson’s Coefficient of Correlation is appropriate. If the data is not known to be (or cannot be assumed to be parametric), then Spearman’s Coefficient of Rank Correlation is more appropriate. Pearson’s Coefficient of Correlation gives us a measure of the linear relationship, whereas, Spearman’s Coefficient of Rank Correlation gives us the monotonic relationship.
